
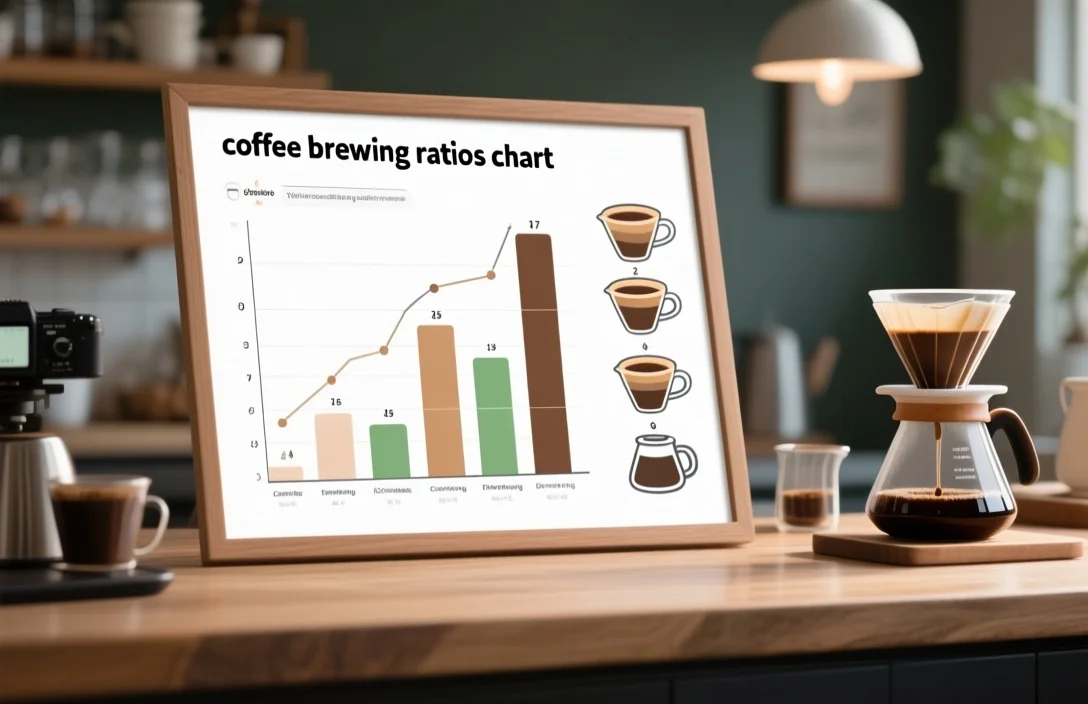
A coffee brewing ratios chart gives you a simple way to turn a desired cup size into the precise mass of coffee and water to use. Use the chart below to pick a target strength and scale the grams for any cup size, then tweak grind, time, and technique until the taste matches your preference.
What a coffee brewing ratios chart is and why it matters
A coffee brewing ratios chart lists the relationship between coffee mass and water mass so you can reproduce a brew consistently. Precision matters because extraction – how much soluble material leaves the grounds – depends on the mass ratio, grind size, contact time, and water temperature working together.
Baristas and serious home brewers rely on mass-based ratios rather than scoops or tablespoons because volume measurements for coffee are inconsistent; a single tablespoon of finely ground coffee can weigh significantly more than a tablespoon of coarsely ground coffee. Consistent dosing improves repeatability: when you change a single variable, such as grind or bloom time, a reliable ratio isolates that change so you can judge its effect on taste.
Quick chart: common home-brewing targets and how to use them
Use the table below as a starting point. Column entries show common coffee-to-water ratios used by many home and cafe brewers, a plain-English strength descriptor, and a quick conversion for a 300-ml cup. Treat these as starting points, not hard rules; taste and local water quality will change what feels “right.”
| Strength | Coffee: Water Ratio | Coffee for 300 ml (g) | Best for |
|---|---|---|---|
| Strong | 1:14 | 21.4 g | French press, bold pour-over |
| Balanced | 1:16 | 18.75 g | Pour-over, drip, most home brewing |
| Mild | 1:18 | 16.7 g | Longer extraction, lighter-bodied brews |
| Very light / Iced | 1:20 | 15 g | Cold brew concentrate dilution, delicate clarity |
Follow this quick method to use any ratio:
- Choose a strength row from the table.
- Measure target water mass in grams (300 ml = 300 g for water).
- Divide water grams by the ratio denominator to get coffee grams.
- Adjust grind and brew time to correct under-extracted sourness or over-extracted bitterness.
Why the ratio changes the flavor
Solubles in coffee dissolve at different rates; acids and some aromatics dissolve quickly while heavier bitters take longer to extract. A higher coffee-to-water ratio increases the concentration of dissolved solids in the final cup, which you perceive as body and intensity. A lower ratio spreads the same dose of soluble compounds across more water, producing a lighter body and lower perceived intensity.
Grind size affects extraction rate strongly. Finer grinds expose more surface area and increase extraction for the same ratio and time, while coarser grinds slow extraction. Water temperature also changes how fast compounds dissolve: hotter water extracts more quickly. Use ratio, grind, and temperature as a three-way control system – start with the ratio for the base strength you want, then tune grind and time to dial extraction and clarity.
How to build a personal brewing ratios chart
Follow these steps to create a chart tailored to your taste and equipment.
- Gather tools: use a digital scale with 0.1 g resolution, a kettle that can hold a steady temperature, and a timer.
- Pick three target strengths to test, for example strong, balanced, and mild.
- For each strength, choose an initial ratio (use the table above as a starting point).
- Brew three consecutive cups with identical water temperature and grind distribution, changing only the ratio between brews.
- Record every parameter: coffee grams, water grams, grind setting, water temperature, total brew time, and tasting notes.
- Compare sensory results and mark which ratio produced the preferred balance of sweetness, acidity, and bitterness.
- Repeat the test varying only one additional parameter at a time (grind or time) to confirm the cause of any change.
Use the data you collect to create a simple spreadsheet with columns for cup size, ratio, coffee grams, water grams, grind setting, time, and notes. That spreadsheet becomes your personal brewing ratios chart for every method you use.
How ratios differ by brewing method and why
Pour-over: Pour-over methods usually favor balanced clarity and aroma, which most people achieve in the balanced-to-mild ratio band. Incremental pouring technique, filter type, and paper thickness all influence yield and perceived strength, so keeping the ratio consistent while changing pouring intensity isolates the effect of technique.
French press: The immersion process favors a shorter extraction rate for body and oil retention. A slightly higher coffee dose produces the heavy mouthfeel many expect from French press. Coarser grind lowers fines that otherwise over-extract during long immersion.
Aeropress: A versatile method that is recipe-driven. Many Aeropress recipes use concentrated brew weights and then dilute to taste, so base ratios can be higher if you plan to add water after pressing. Inverted or standard orientation changes immersion and agitation, so record the exact procedure in your chart.
Espresso: Espresso uses pressure and fine grind rather than the same mass-based ratios used for manual methods. Dose-to-yield ratios such as 1:2 (espresso yield relative to dose) are common, but those figures represent a different measurement concept – mass of brewed coffee compared to mass of input espresso grounds. Keep espresso in a separate chart to avoid confusing methods.
Cold brew: Cold-brew concentrate recipes often use high coffee-to-water ratios because final serving is diluted. If you brew a concentrate, track the concentration and the intended dilution ratio so your chart shows final serving strength rather than just concentrate strength.
Table: method-specific starting points and key variables
This table groups recommended starting ratios, but lists the variables you must control for each method.
| Method | Suggested Range (starting) | Key variables to record | Notes |
|---|---|---|---|
| Pour-over (paper) | 1:15 – 1:17 | Pour schedule, bloom time, filter type | Paper filter traps oils; clarity increases with finer pours |
| French Press | 1:12 – 1:15 | Immersion time, plunge speed, coarseness | Longer steep times and coarser grind produce fuller body |
| Aeropress | 1:12 – 1:18 (recipe-dependent) | Inverted vs standard, plunge time, water temp | Many recipes concentrate and dilute after pressing |
| Cold Brew (concentrate) | 1:4 – 1:8 (concentrate) | Steep time (12-24 hrs), grind size | Dilute concentrate to serving strength in final chart |
Record values in your chart for at least three brews per method to account for batch variability and daily freshness changes.
Practical
Example calculation for scaling:
- If you want a 500-ml cup at a balanced ratio of 1:16, divide 500 by 16 to get coffee grams.
- For a 1-liter batch in a French press at a strong ratio of 1:14, divide 1000 by 14 and round to a convenient gram measure.
When batch brewing, account for retained water in grounds (absorption). A simple rule to track in your chart is to measure actual final yield after decanting and note the difference between water poured and coffee yield. The volume retained in grounds varies with grind size and roast; record it for each method and batch size so your chart reflects realistic serving yields rather than poured water totals.
List: common scaling pitfalls to track
- Changing roast level without adjusting ratio or grind.
- Using volume scoops instead of mass, which creates dose drift.
- Forgetting to account for water absorbed by grounds when making concentrate.
- Switching filter types mid-test (paper to metal) and treating results as comparable.
Record all such conditions in your chart metadata so future brews remain comparable.
How to adjust the ratio when taste is off
Taste-based adjustments are the fastest way to iterate toward your preferred cup.
If the cup tastes overly sour or thin:
- Decrease the ratio denominator (use more coffee per water) to increase body and perceived sweetness.
- Coarsen the grind only if the cup also tastes overly bitter or muddy; otherwise focus on dose first.
If the cup tastes overly bitter or astringent:
- Increase the ratio denominator (use less coffee per water) to lower concentration.
- Coarsen the grind and shorten brew time to reduce over-extraction of heavy bitter compounds.
If the cup lacks clarity or tastes muddled:
- Check filter type and fines in the bed; for immersion methods try a slightly coarser grind.
- Reduce agitation and shorten contact time in methods sensitive to agitation, then adjust ratio if needed.
Always change one variable at a time and log the outcome in your chart to build a reliable decision history.
Common mistakes and how to avoid them
Many brewers blame ratio when another variable is the real cause of a bad cup.
Mistake: Using volume measures (scoops) and assuming consistent weight.
Avoidance: Switch to a scale and record grams in your chart.
Mistake: Expecting identical results across different water sources.
Avoidance: Note water source and treatment (tap, filtered, mineral composition) in your chart; water mineral content affects extraction and mouthfeel.
Mistake: Changing ratio and grind at the same time.
Avoidance: Alter only one parameter per test and note the change in the chart.
Mistake: Not allowing beans to degas after roasting or using stale beans without updating dose.
Avoidance: Record roast date and adjust ratio if beans taste flat; fresher beans can taste brighter at the same ratio.
A disciplined chart prevents chasing the wrong variable. Track every change so subtle trends become visible.
How to record, store, and use your chart efficiently
Use a simple spreadsheet program or a notes app structured like this: Date | Method | Roast | Dose (g) | Water (g) | Ratio | Grind setting | Temp (°C/°F) | Time | Yield | Taste notes. Update the chart after each brew and export monthly snapshots to spot trends.
Printed or laminated cards for your most-used methods save time in the morning. Include a “go-to” line for your regular cup, a “weekend treat” stronger line, and a “travel” line for when you’re using unfamiliar equipment. Keep your master chart in a central place so everyone in your household can reproduce your favorite cups.
When to deviate from the chart
Use your chart as a baseline, not a cage. Creative brewing – like experimenting with concentrated Aeropress recipes or cold-brew infusion – requires intentional deviation and recording. If you pilot a new technique, start with a conservatively altered ratio and document every variable so you can return to baseline quickly if you don’t like the result.
Professional cafes vary ratios by origin and roast profile to highlight desired attributes; you can do the same at home. Track how beans from different origins behave at the same ratio and note whether a particular origin benefits from a slightly denser or lighter ratio.
FAQ
What is the easiest ratio to start with?
Start with a balanced ratio near the middle of the table labeled “Balanced” and then adjust by taste across sessions. That central point tends to reveal whether a bean needs more or less concentration before changing other parameters.
Should I measure by volume or weight?
Measure by weight. Mass-based measurement eliminates the variability of grind particle size and packing that makes scoops unreliable across brews.
Do I need different charts for each brewing device?
Yes. Different methods extract differently due to pressure, immersion time, and filter properties, so keep a separate chart or at least separate rows for each device in the same spreadsheet.
How often should I update the chart for a single coffee bag?
Update after each roast age milestone you notice: fresh roast, after 3-7 days, and after two-to-three weeks, since roast age and degassing can change perceived sweetness and aroma.
Can I use one ratio for hot brew and cold brew?
Not directly. Cold brew uses time and low temperature to extract; many cold-brew recipes begin with a concentrate and then dilute to serving strength, so track concentrate ratio and intended final dilution separately in your chart.
Short practical verdict and next
A coffee brewing ratios chart converts taste goals into reproducible math and saves you from guessing on every brew. Create a simple spreadsheet today using the table above, run three controlled brews at different ratios to find your baseline, and then keep a log of every change for two weeks to lock in a repeatable routine.

- Espresso Tastes Watery? 10 Common Causes and How to Fix It - October 23, 2026
- 10 Common Coffee Equipment Cleaning Mistakes and How to Avoid Them - October 23, 2026
- 17 Common Coffee Grinder Problems and How to Fix Them - October 23, 2026